Bring your story to light, watch your business shine

Services

  • Collection of icons including a document, lightbulb, dollar sign, target with arrow, person, bar chart, percent sign, equal sign, and hashtag, arranged in a grid with some icons highlighted in blue.

    Presentations & Pitch Decks

    Whether you're stepping onto the keynote stage, walking into a boardroom, or sending a pitch deck to investors, you only get one shot! Let's make it count.

  • Outline drawing of a computer monitor displaying a pie chart with a blue segment, a magnifying glass with a bar graph inside it positioned in front of the monitor, a power plug connected to the monitor, and a small dot at the bottom center of the monitor.

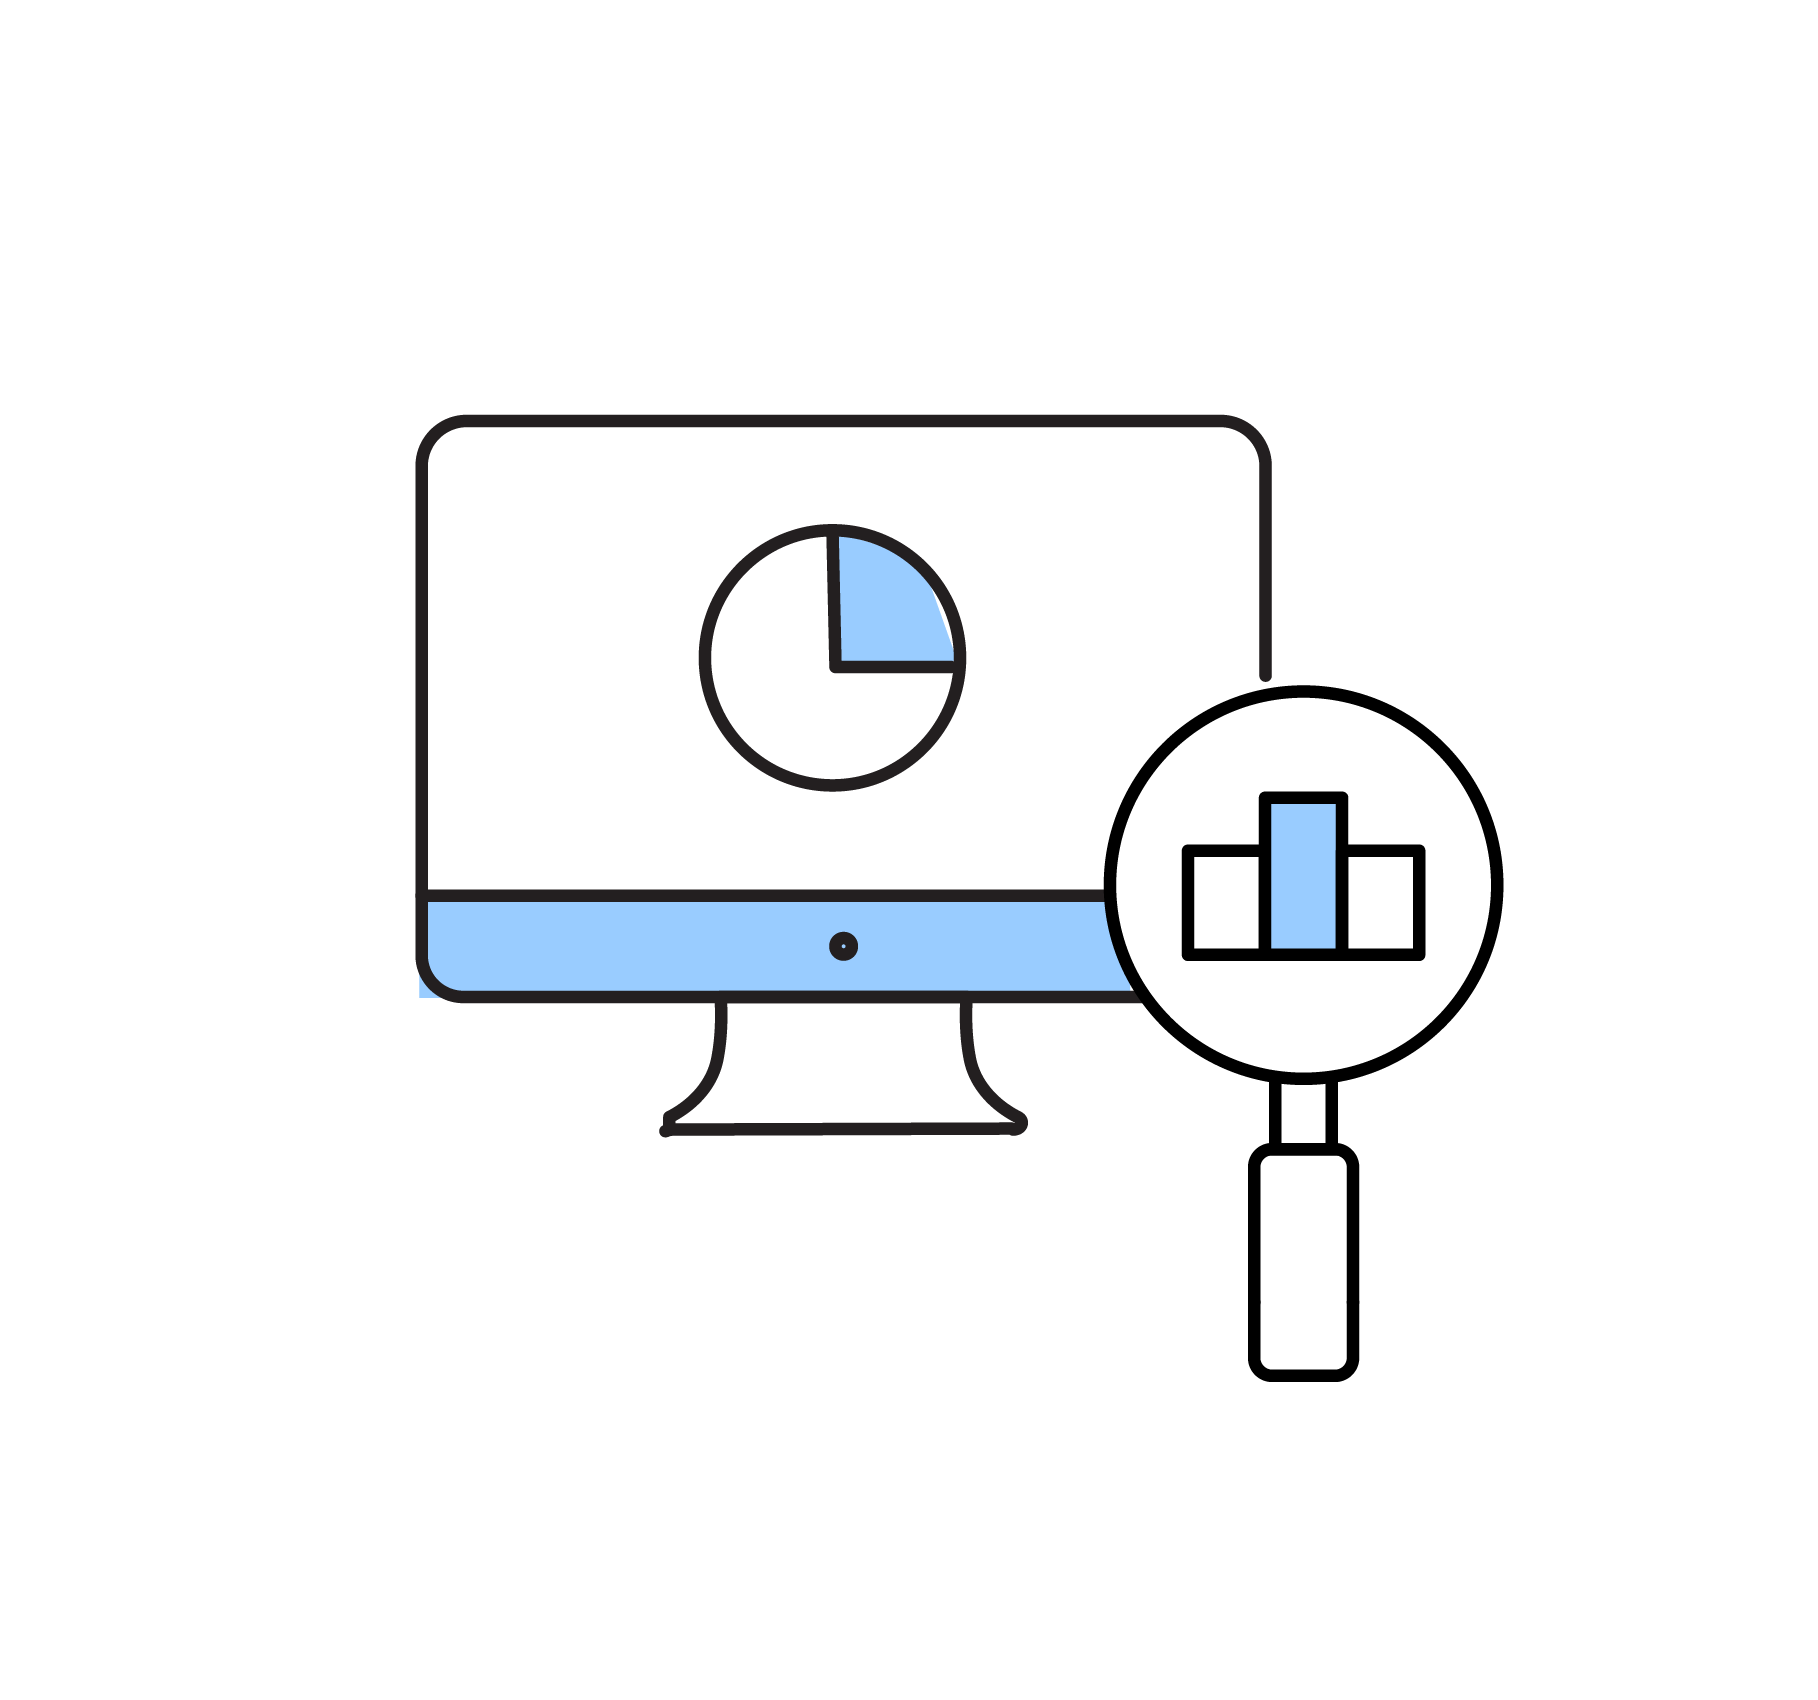
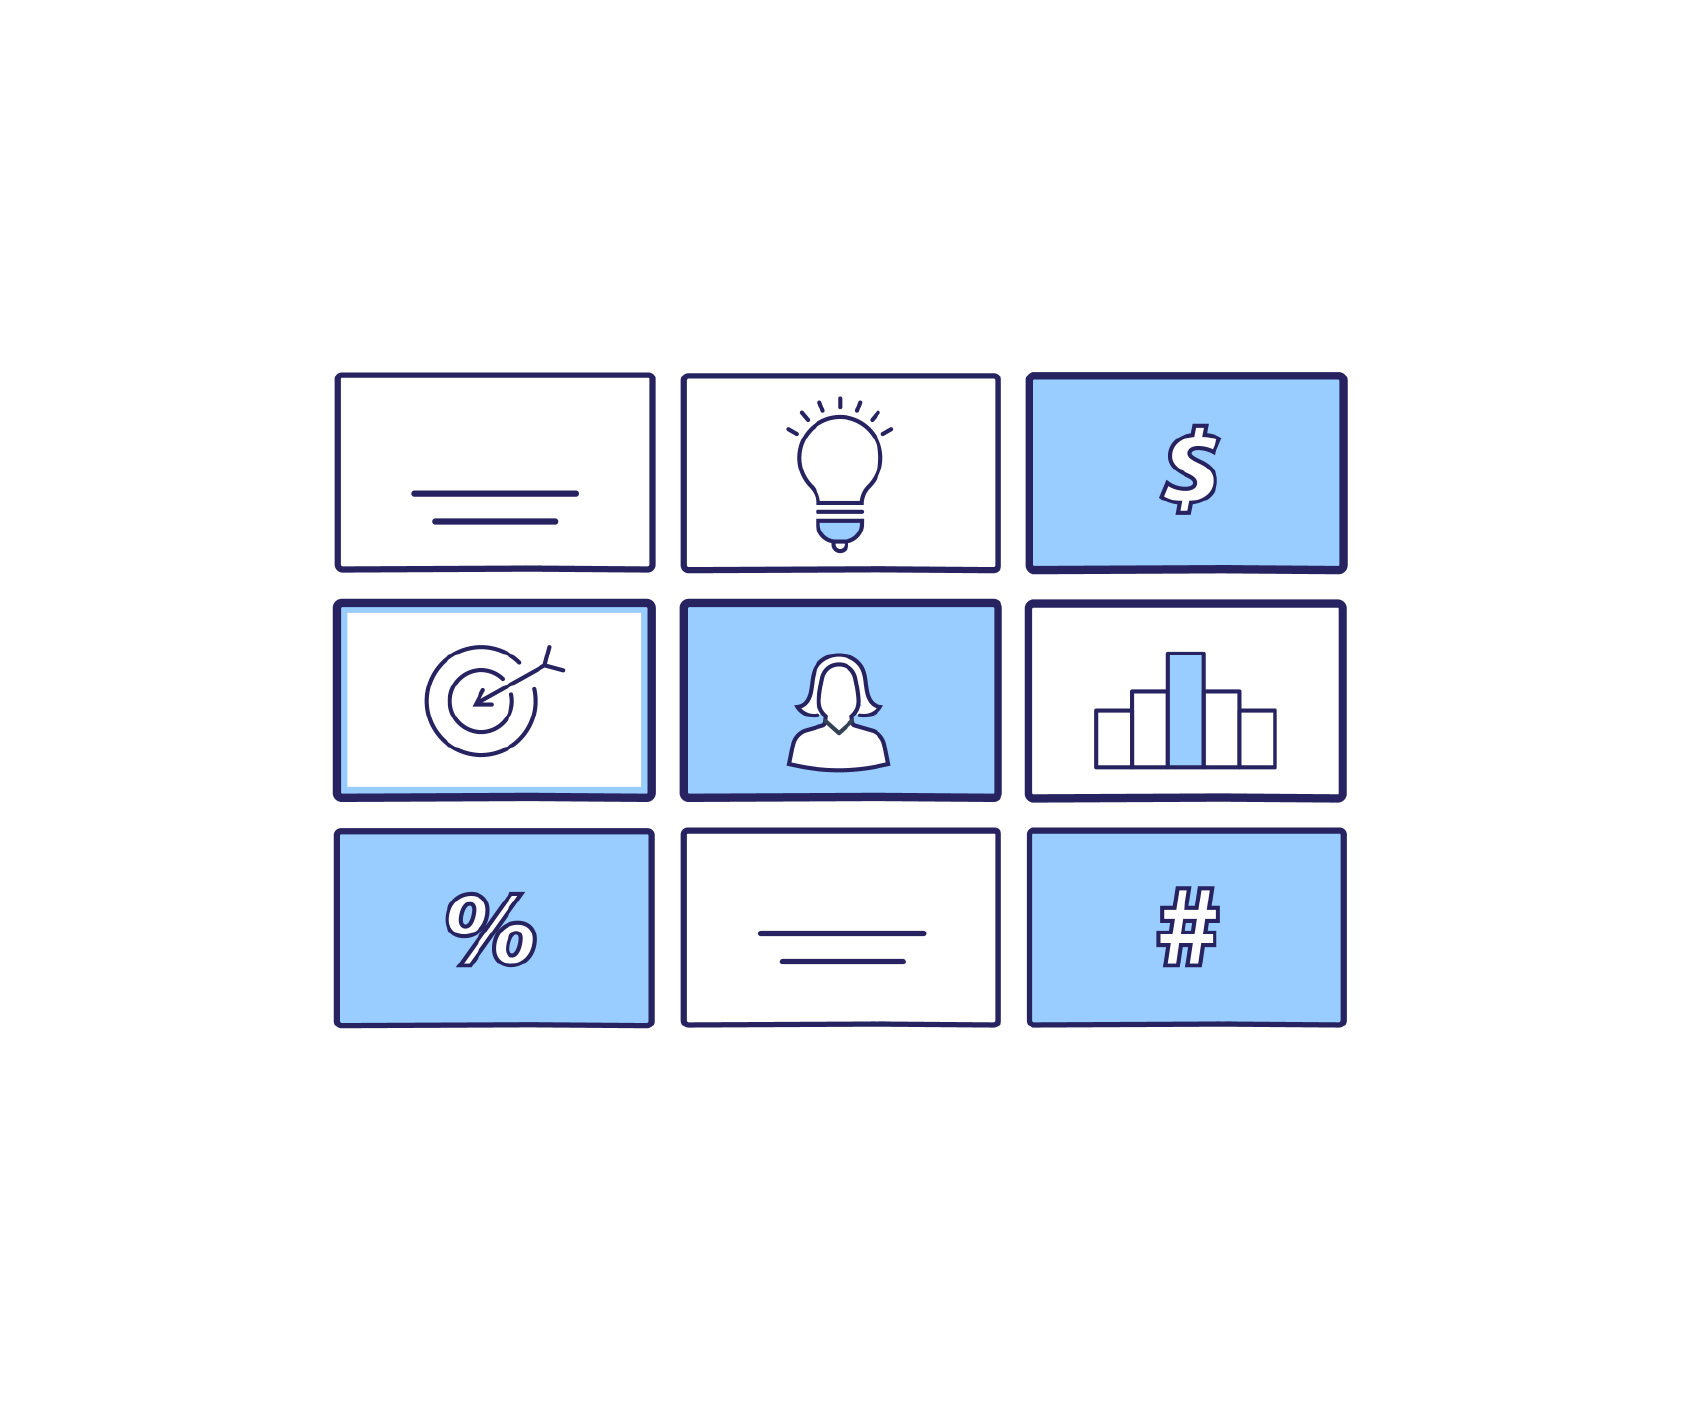
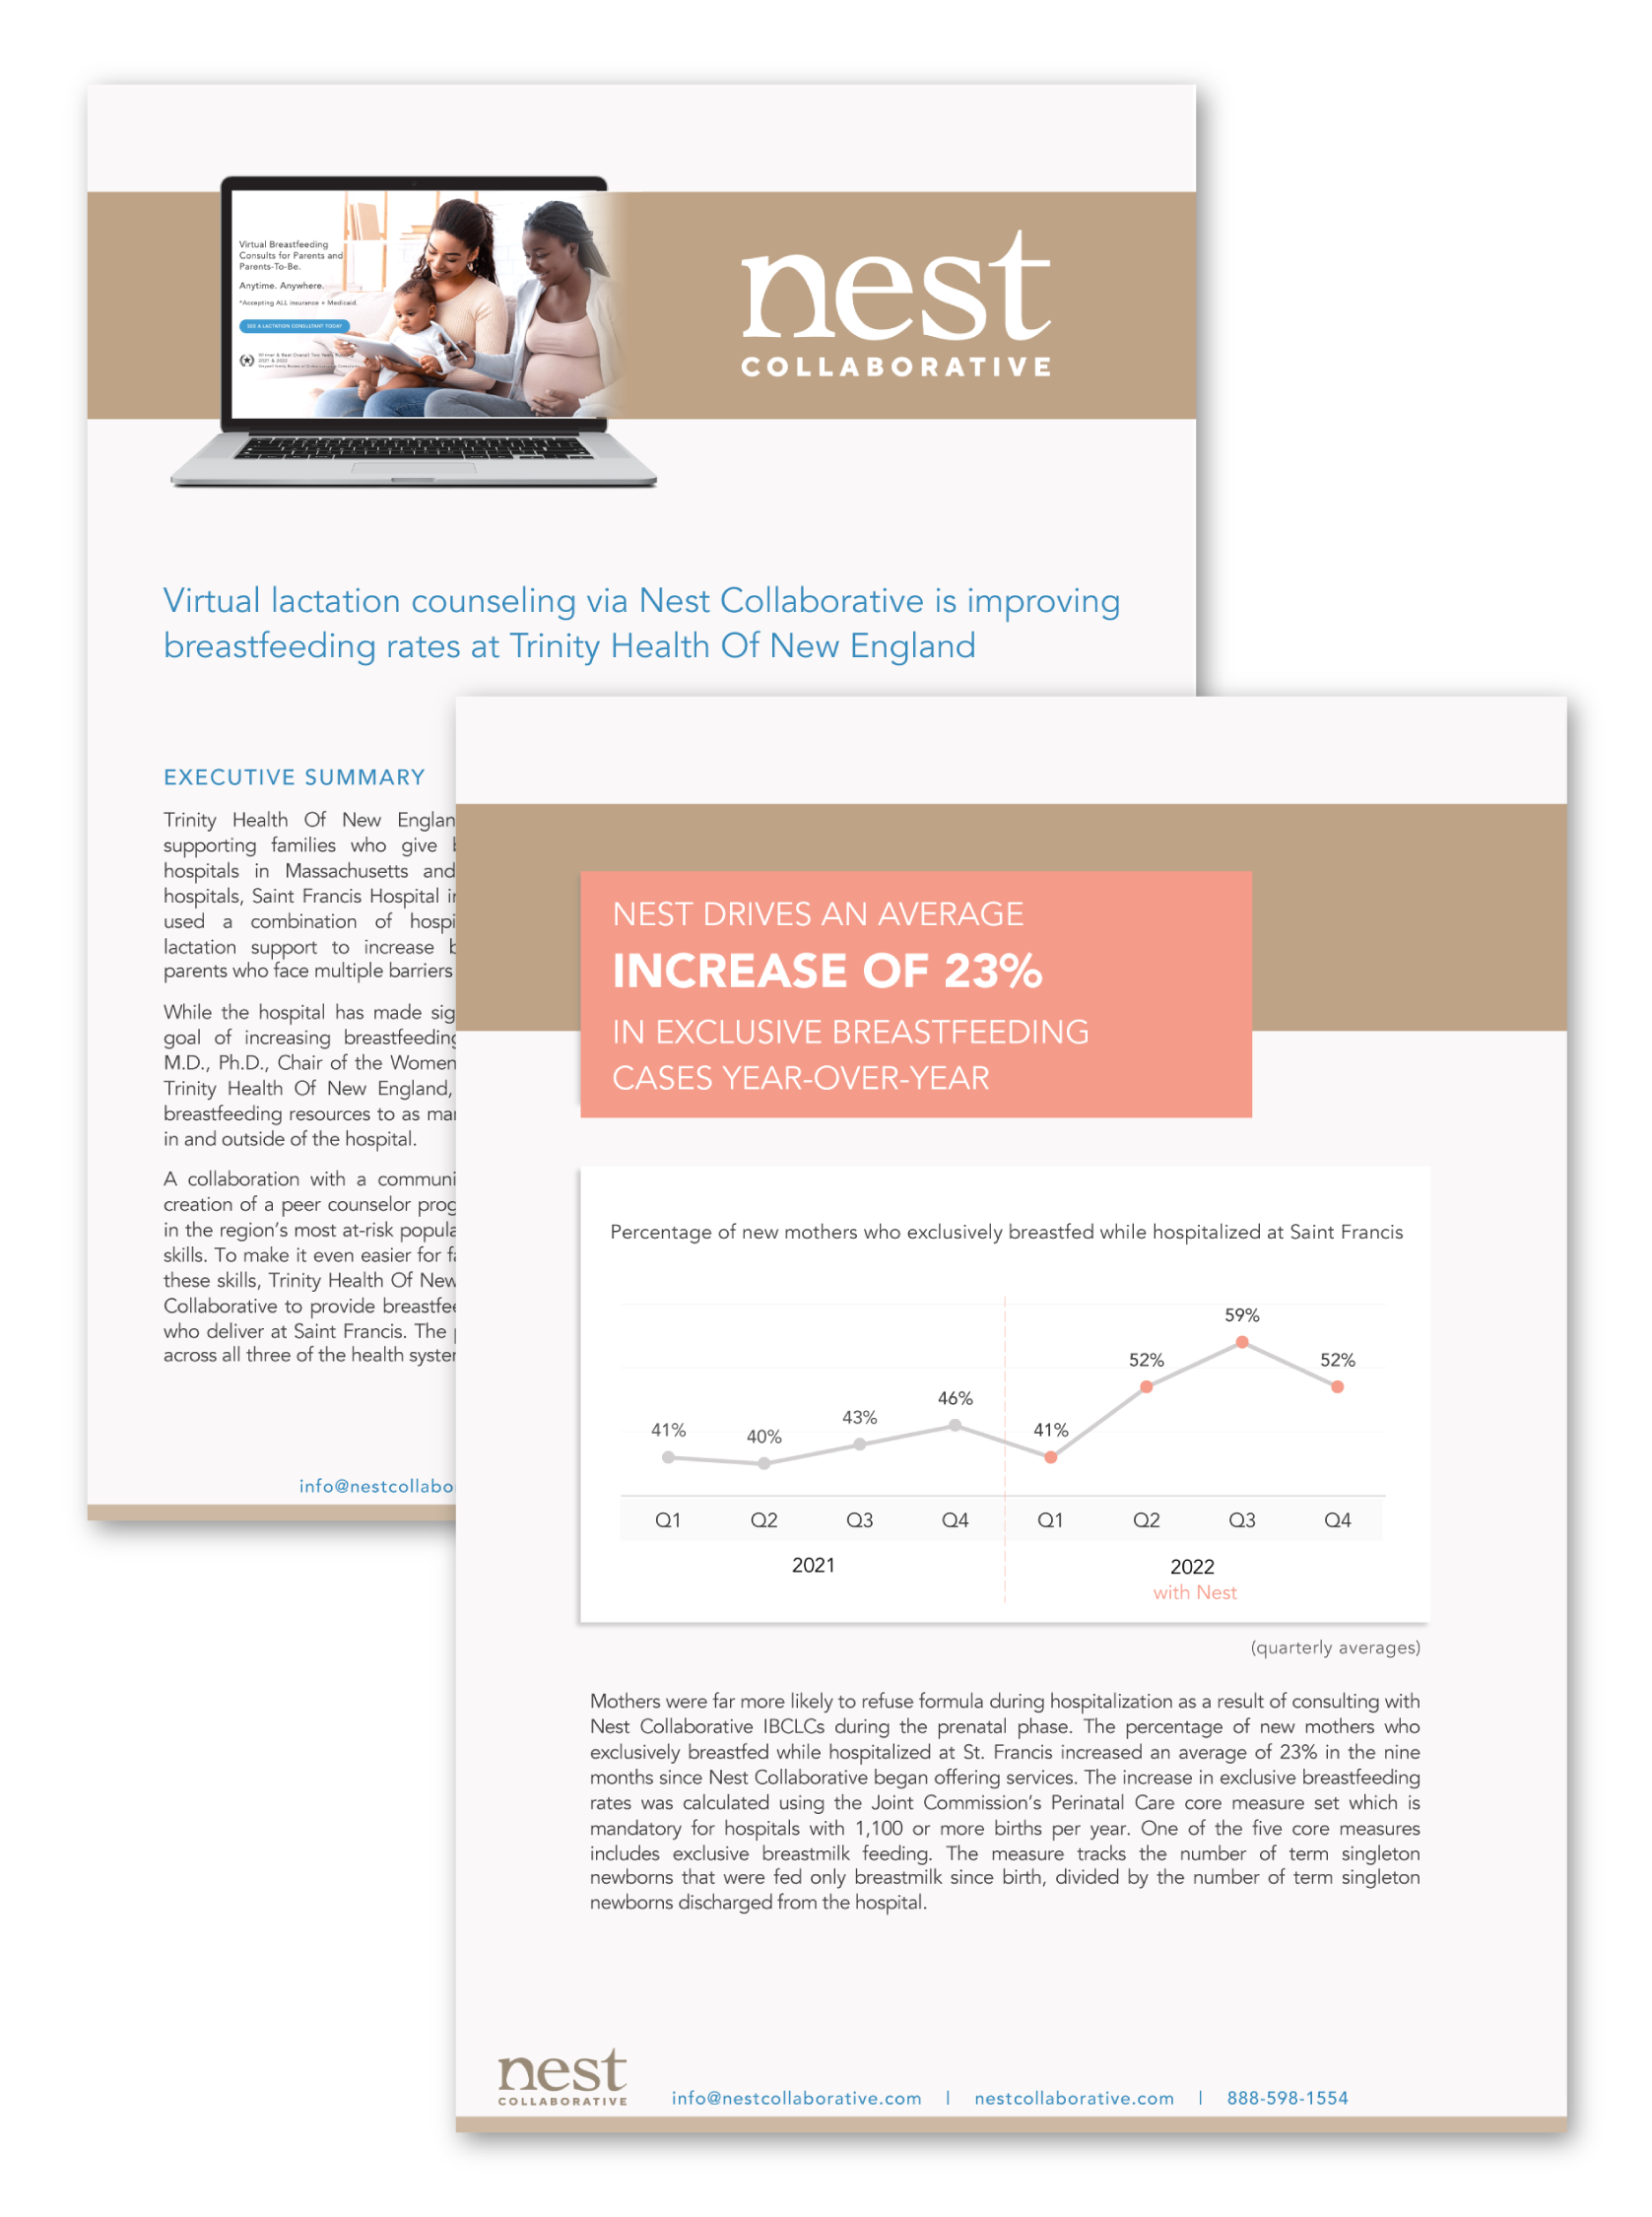
    Data Visualization & Infographics

    Numbers alone don't persuade. Stories + numbers do. Let’s translate that dense data set or complex business model into a clean, compelling visual that helps your audience grasp the ‘so what’ in seconds.

  • Minimalistic diagram of a person standing in front of a presentation board or screen.

    Events & Conferences

    Your conference has a hundred moving pieces: keynote slides, workshop materials, signage, eblasts, event invitations, social posts, and more. Let's make sure every touchpoint looks on-brand and tells the right story about your organization.

WHO WE
WORK WITH

Start-Ups

Nonprofits

Solopreneurs

Service-Based Companies

Marketing & Research Teams
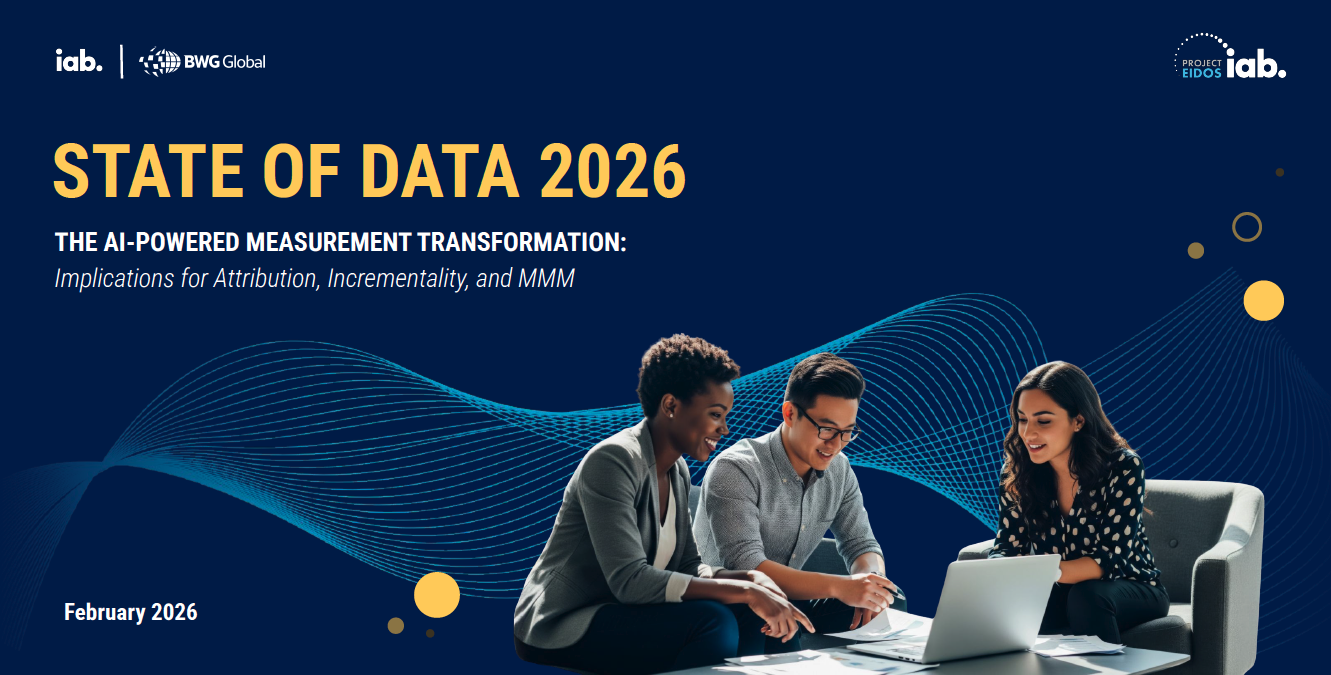
FEATURED WORK

Cover slide for a report titled 'State of Data 2026' with a subtitle 'The AI-Powered Measurement Transformation: Implications for Attribution, Incrementality, and MMM' and the date February 2026. The slide features three people sitting on a sofa, looking at a laptop, with a blue background and abstract wave design.
  • A flowchart diagram with the phrase "we work in the space between you & your" and words like "brand," "audience," "idea," "company," "investors," and "customers" connected by arrows.

  • A light blue background with dark blue text that reads, 'You can't read the label from inside the jar. You need help from the outside.'

  • List of three things people like to do, including: 1. having an interesting history, 2. much talked or written about, 3. legendary or famous.

WAYS TO WORK TOGETHER

  • For clients with ongoing visual communication needs, a retainer means you always have a partner who knows your brand, your audience, and your goals. No re-explaining. No starting from scratch. Just consistent, momentum-building work month after month that compounds into something stronger over time. Available in 6 or 12-month engagements. We’ll build a consistent visual presence across: newsletters, pitch decks, sales materials, reports, infographics, event collateral, and more.

  • Got a specific need and a real deadline approaching? An investor meeting or a speaking engagement on the calendar? Project-based work is designed for exactly that — a defined scope, a clear timeline, and a focused collaboration from discovery to final delivery. Walk away with polished, ready-to-use materials and full ownership of everything we create together.

  • A 2-hour strategy session is the fastest way to get unstuck. Bring a messaging challenge, a deck you want reviewed, or a design decision you can't quite land. Leave with a clear point of view and next steps you can act on.

Collection of logo icons representing various digital and creative software programs, including Microsoft Word, WordPress, Canva, PowerPoint, Excel, Adobe Creative Cloud apps, Google, Adobe, and Squarespace, in grayscale with some blue accents.

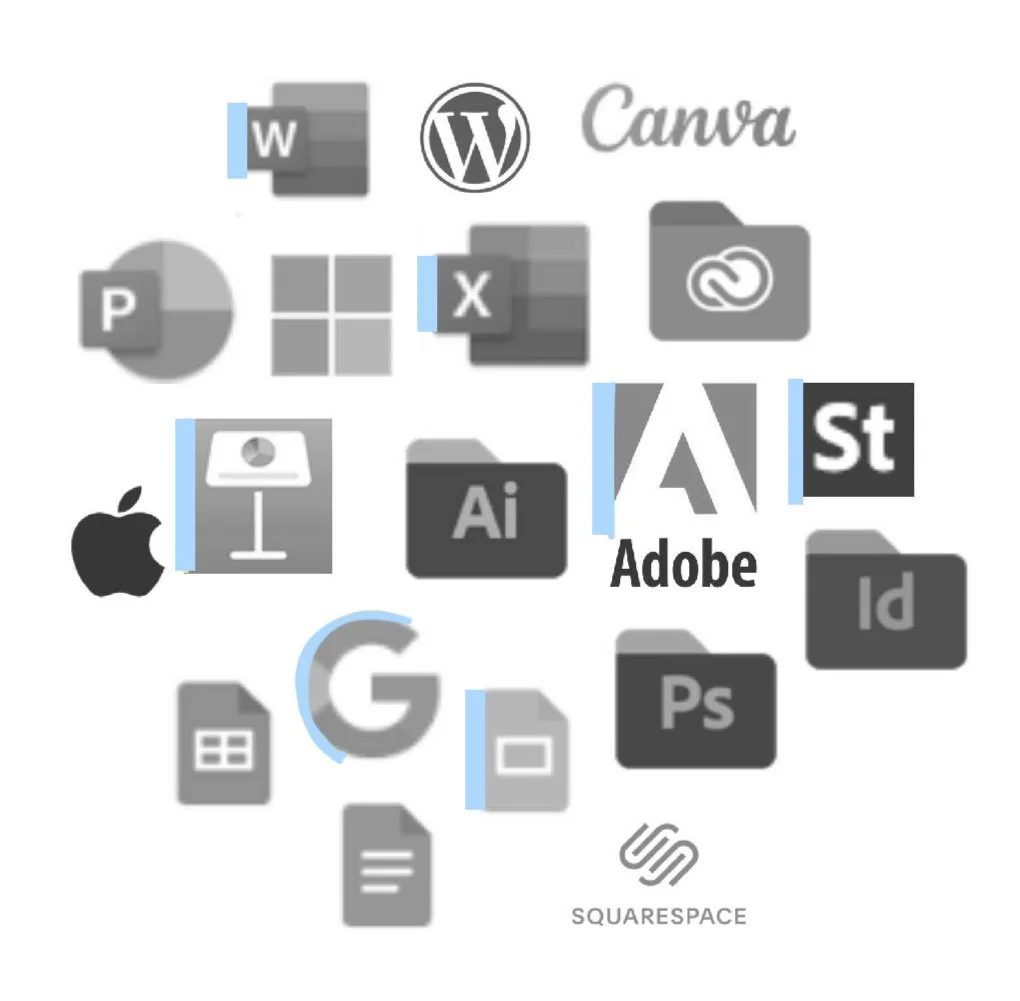
SOFTWARE COMPATABILITY

Proficiency working with (and between):

  • Adobe Creative Suite: Acrobat, After Effects, Photoshop, Illustrator, InDesign, Stock, Express

  • Microsoft 365: Excel, PowerPoint, SharePoint, Word

  • Google Workspace: Slides, Sheets, Docs, Drive,

  • Canva, Keynote, Notion, Squarespace, WordPress, Pitch, Visme and more!

  • "Kim is a master of data visualization who has been a tremendous value for me and my company throughout a series of funding rounds."

    - Amanda G, Fem-Tech Founder, Nest Collaborative

  • "I just want to let you know that we rocked our presentation!"

    - Margo D, Chief of Staff, ReadWorks

  • "Kim translated my detailed and exceedingly dry data points into a compelling story that was also visually sophisticated."

    - Deb T, Owner and Founder, Transcend Technology

Proud member of The Presentation Guild and The Data Visualization Society.

A digital graphic with a gradient blue background and colorful horizontal stripes at the bottom. White text states, 'All are welcome here.'
Blue line drawing of a bar chart with rising bars, connected by a continuous line that forms a light bulb on the right side.

Need visuals that work as hard as you do?